「3次元グラフを描くには」の版間の差分
提供: tknotebook
| 4行: | 4行: | ||
3次元グラフを描くには splot コマンドを使います。splot の s は surface のことだそうです。 | 3次元グラフを描くには splot コマンドを使います。splot の s は surface のことだそうです。 | ||
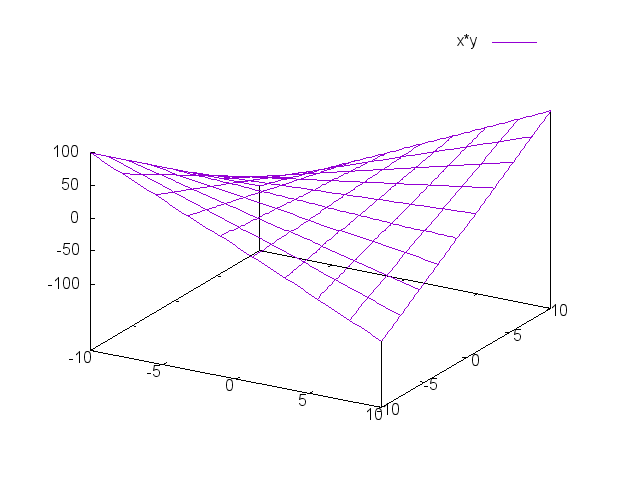
| − | 既定では splot は陽関数 <math>z = f(x, y)</math> を描きます。 以下のコマンドは z = | + | 既定では splot は陽関数 <math>z = f(x, y)</math> を描きます。 以下のコマンドは <math>z = xy</math> を描きます。 |
splot x*y | splot x*y | ||
2015年8月7日 (金) 13:29時点における版
3次元グラフを描くには splot コマンドを使います。splot の s は surface のことだそうです。
既定では splot は陽関数  を描きます。 以下のコマンドは
  を描きます。
splot x*y
描画例
